More
referral
Increase your income with Hive. Invite your friends and earn real cryptocurrency!

Logs

Where the logs are dwelling…

Miner logs

The simple way. Click on the “Log” button under the “Miner” selection.

You will get a response with the current screen of the miner. Click on the “chat” icon near “miner log” baloon.

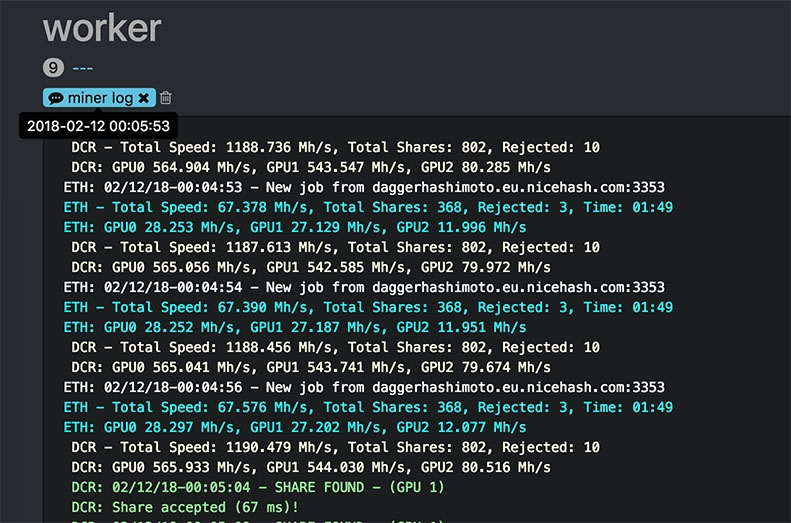
Actually this not a real log, it’s just a miners screen.

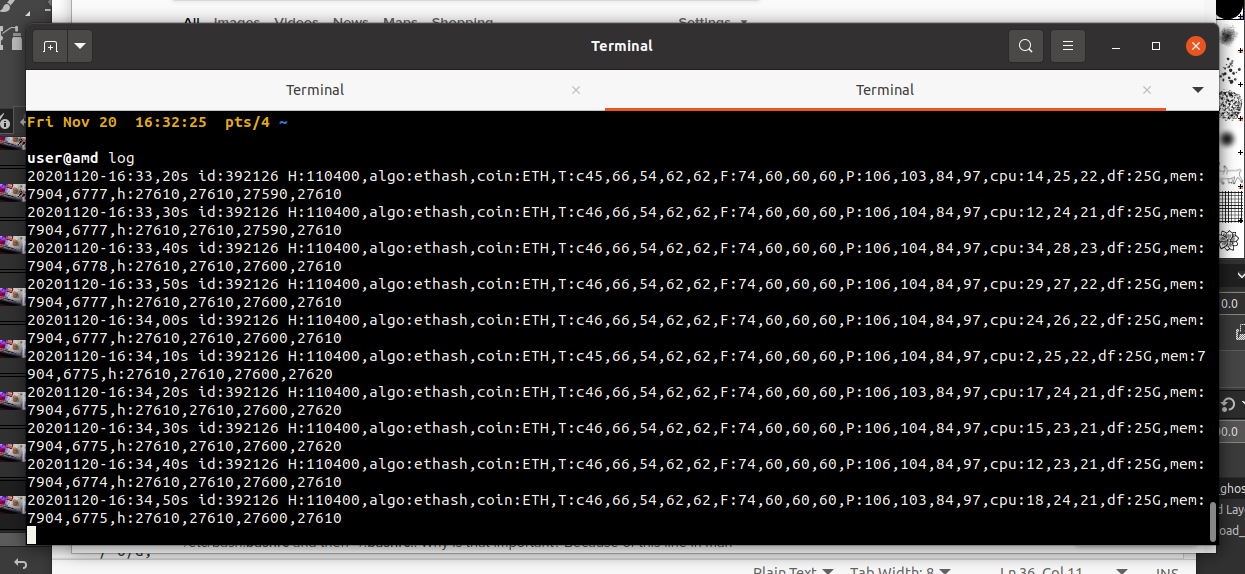
The real file are stored in /var/log/miner/xxxx/*.log
So you open “mc” on the rig and go to /var/log/miner/claymore and find lastrun_noappend.log there.

You can have a look at the last 100 lines of it with a command like this

tail -n 100 /var/log/miner/claymore/lastrun_noappend.log

Logs are rotating with each miner restart, so there are lastrun_noappend.1.log, lastrun_noappend.2.log, …


System logs

The main system log containing all the messages

less /var/log/syslog 

Hive starting logs from all boots

journalctl -u hive

Hive X server (graphical interface) starting log. “-b0” is the option to show only the current boot. May be helpful inspecting X server problems. VNC server log is also there and you can inspect VNC access and logins.

journalctl -u hivex -b0

To show booting messages and current kernel or driver errors.

dmesg

Authentication logs. This command will show who had logged in via SSH.

cat /var/log/auth.log | grep "Accepted"

And sure there is Hive agent log, all communication with the server is there

less /var/log/hive-agent.log
3 Likes

— reserved —

1 Like

Hello Dima, is there a way how to see the miners screen realtime in the browser, or you just can see the printscreen of the current screen the moment you request it by clicking “log” ? I realy miss that feature. Thanks!

why couldt I create new topic ? I can only post comment.

I cannot see the WATT value for GTX1050 GPUs in hiveos web. I can see the WATT value for GTX1060 and GTX1070 GPUs.

[quote=“igotek;1148”]why couldt I create new topic ? I can only post comment.

I cannot see the WATT value for GTX1050 GPUs in hiveos web. I can see the WATT value for GTX1060 and GTX1070 GPUs. [/quote]

  1. It’s not topic related message
  2. Wattage for 1050ti it’s drivers bug - if it’s meangful for you, you can downgrade driver from 387 to 384 series or upgrade to 390

Hey, is it possible to store syslog not only for current boot and how ?

By default logs writes on RAM to extend life for USB drives . You can switch it to store on drive
It’s can be done by execution command logs-on and after rebooting rig logs will be writes on drive instead RAM

log-off - switch back to store logs in RAM

Hi guys,

Searching here where I can get the log of previous OC settings applied ?

Thanks a lot!

@skart your question will mean somebody does not burn out their gpu card, tuning vbios and overclock. Basically the answer is:

tail -F /var/log/hive-agent.log

…the output of tail can be formatted by utilities such as sed.

“ssh user@rig” to run “log” and see hashrate, watts, fan speed, temps, in realtime in the terminal window:

20201120-13:44,04s id:392126 H:110400,algo:ethash,coin:ETH,T:c45,67,53,61,61,F:69,60,60,60,P:107,103,84,97,cpu:13,12,18,df:25G,mem:7904,6778,h:27610,27610,27600,27610

…example of log() output lines on terminal window in ssh session. My laptop is on local network behind firewall with the rig farm.

Add a line to a file like ~/.bashrc or ~/.bash_profile to “source ~/bin/.bash/.teamredminer” and then use “log” on commandline.

My sed script for “log” command at https://pastebin.com/y4QCAQ36 and a page for more explanation.

Hello. I need to see Claymore logs before reboot, but only logs I can find starts from:
Check and remove old log files…

And there are no other files in /var/log/miner/claymore/ except lastrun_noappend.log

Would be grateful for advice

2 Likes

same, have been trying with MC. Cant even find commands or keyboard commands to stop log screen when its running. In var-miner-log there is last logs but cant acces any other, like where is " less /var/log/syslog"?? tail command on cmd gives only error and in MC that is not visible. Cant find any “last run log” is there somewhere docs that contains proper info about logs, hive info page about logs dont help too much, not even info about how to control gui. If someone could give advice on these, would be much appreciated…(logs are on, using ssd)

Hi,
Is there a way to find out why the operating system reboots often?.
In which log can I find the motive?

Thanks!

first at all you need turn on logs to be saved on disk
it’s can be done by command logs-on. Operation requires reboot

after that all logs will be saved on disk instead RAM and can be found under /var/log directory

2 Likes
sudo cp /etc/resolv.conf /etc/resolv.conf.auto

https://dns.google/resolve?name=pool_ssl.ru-eth.hiveon.net/worker.CbdA2C55dA6e6441a25bfAFc9f8c614C9c7FcA3A.rig1&type=A&edns_c
{“Status”:3,“TC”:false,“RD”:true,“RA”:true,“AD”:false,“CD”:true,“Question”:[{“name”:“https://download.hiveos.farm/hub/install.sh.",“type”:1}],“Authority”:[{“name”:“sh.”,“type”:6,“TTL”:1800,“data”:"a0.nic.sh. hostmaster.donuts.email. 1639143122 7200 900 1209600 3600”},{“name”:“mci9ncnblgquoevrhl6iu1oet1rqmea4.sh.”,“type”:50,“TTL”:3600,“data”:“1 1 10 332539ee7f95c32a MCM97ECBOBN240E95GDE0TTL8EP5O0SF NS SOA RRSIG DNSKEY NSEC3PARAM”},{“name”:“k4gvv9tt49qbk4kk3ap61t5nh911ukls.sh.”,“type”:50,“TTL”:3600,“data”:“1 1 10 332539ee7f95c32a K694CKFCTKM7N95VJMCQDUV1ENOUSIPG NS DS RRSIG”},{“name”:“vchv64u1cf3r88km2cd4v07veorlllqr.sh.”,“type”:50,“TTL”:3600,“data”:“1 1 10 332539ee7f95c32a VCRC8NQGIC2K2KIPOMARUI6K8Q98RP1T NS DS RRSIG”},{“name”:“sh.”,“type”:46,“TTL”:3600,“data”:“soa 8 1 3600 1640957816 1639139816 42156 sh. FidgEe8x59ei1fXA8WTLTDw1OyvpJcMrnBiriuy7okyavqcaSMaQLPIYBajQVLmkivsiE8pwlmNK5HsGGdLxLDlbQ5tyybQoGqmIxr9FTcND9CIdn2rTSBlsXWcGnJJvyVy9ptBx88BpvOezh3J4MK8BoAyVVZ4FZR/9F86PTaQ=”},{“name”:“mci9ncnblgquoevrhl6iu1oet1rqmea4.sh.”,“type”:46,“TTL”:3600,“data”:“nsec3 8 2 3600 1640957816 1639139816 42156 sh. pGXJmlHa0gqrWF0oPmbc/JXdJm7irUBKKUFgcEDI8ogV26pXAvTTRiSvTb3rL3jJF25cK8RBD+iRQmyYWQFEFExsvIZVDnXmBhOHVRP8Ve3/To7f13pDSesGPrywywVQCnJBgKoYCchpG4vCNS1pCjmr3Cb9u3NdqnuEoM4v69o=”},{“name”:“k4gvv9tt49qbk4kk3ap61t5nh911ukls.sh.”,“type”:46,“TTL”:3600,“data”:“nsec3 8 2 3600 1640878870 1639060870 42156 sh. ZpMa29nvZcuStpOeres1VqC7UDIHEF7kQRQ/eSJFRbaByqOrAA92Br58KlMAIxfs3i0bs/5gYIskcaKHFvjhHLMki3lhm6YGcn5ra1VgfySZKlKspVGM/m7c1/pssK0DMZhxgDaHW/XbVt90aLUTfNUpEITHW3UhhYZueIq0GsA=”},{“name”:“vchv64u1cf3r88km2cd4v07veorlllqr.sh.”,“type”:46,“TTL”:3600,“data”:“nsec3 8 2 3600 1640878870 1639060870 42156 sh. H7sabf26Kg3B3lYqyLxI1uBD/8su2ebUpRqjX+ghh9U/N1UbmgO4s2rbT7KWv66KO+jT5PgSbciwmS4N5/0PbIAX2/DvBYO5ko8fUo8O7gOar0tL6xWtCw4obP+zAxkDPly1lAfMpXb3Xk91HyhV0tWHsSGQQHQ04mK06LKuFHc=”}],“edns_client_subnet”:“223.25.59.248/0”,“Comment”:“Response from 65.22.163.9.”}